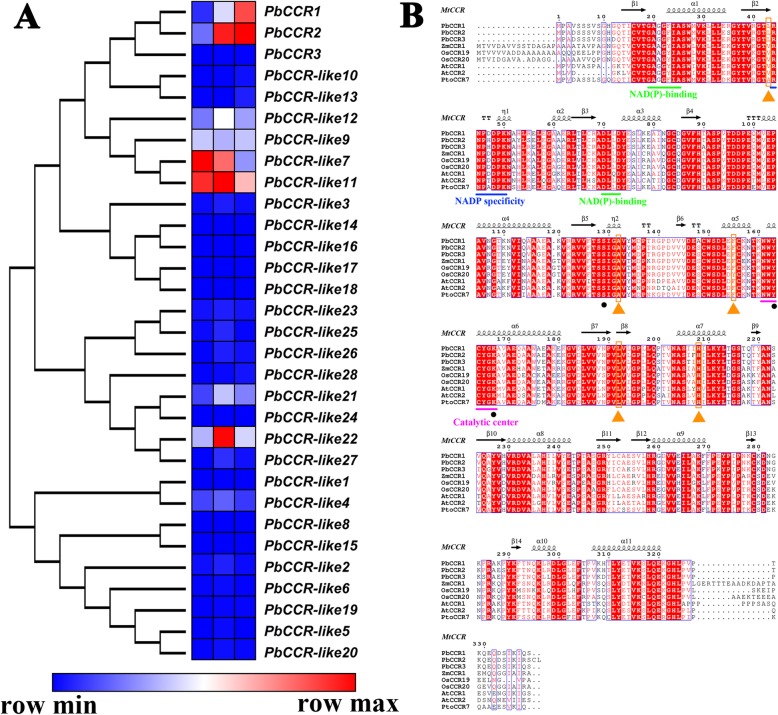
Fig. 5.
Expression profiles of 31 CCR genes in ‘Dangshan Su’ pear and sequence alignment of PbCCR1, 2, 3 against genes from other plant species. a Analysis of the expression patterns of 31 CCR genes. b Using the crystal structure of MtCCR as a template, the blue underline indicates the NADP specificity site, and the green underline indicates the NAD(P) binding site. Black circles indicate catalytic triads. Orange triangles represent key catalytically active amino acid residues. The purple underline indicates the catalytic centre. The black wavy lines and arrows represent α-helices and β-sheets, respectively. ZmCCR1 (CAA74071); OsCCR19 and 20 (Os09g25150, Os08g34280); AtCCR1 and 2 (AAG46037, AAG53687); PtoCCR7 (KF145198)

