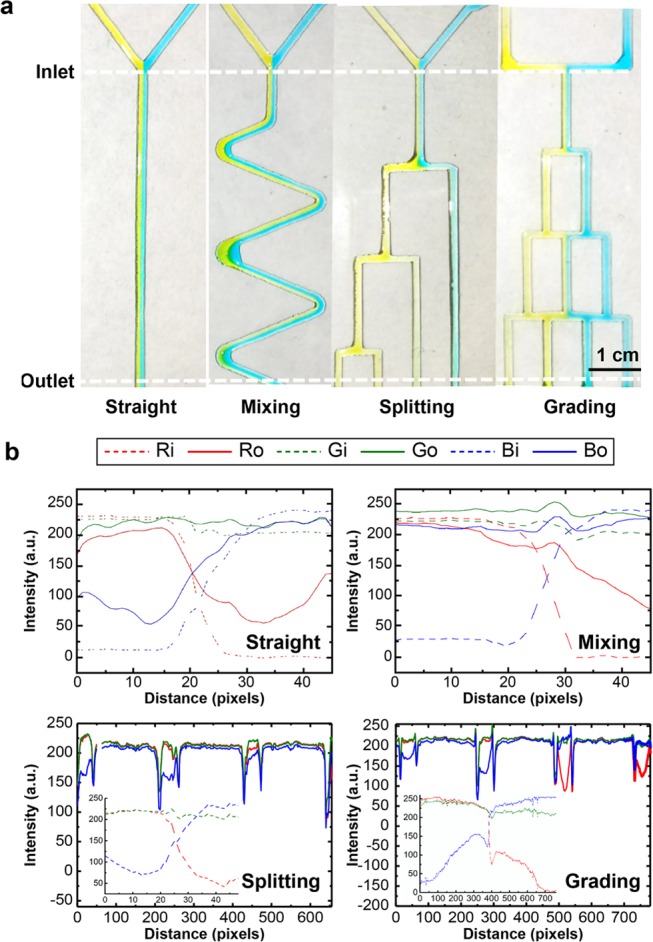
Figure 5.

(a) Flow along different patterns (i.e., straight, mixing, splitting, and merging channels) (450 pixels = 1 cm) and (b) red–green–blue (RGB) analysis of the flow. Moreover, the inserted graphs inside the splitting graph and grading graph are the inlet flow distributions of the RGB analysis.
