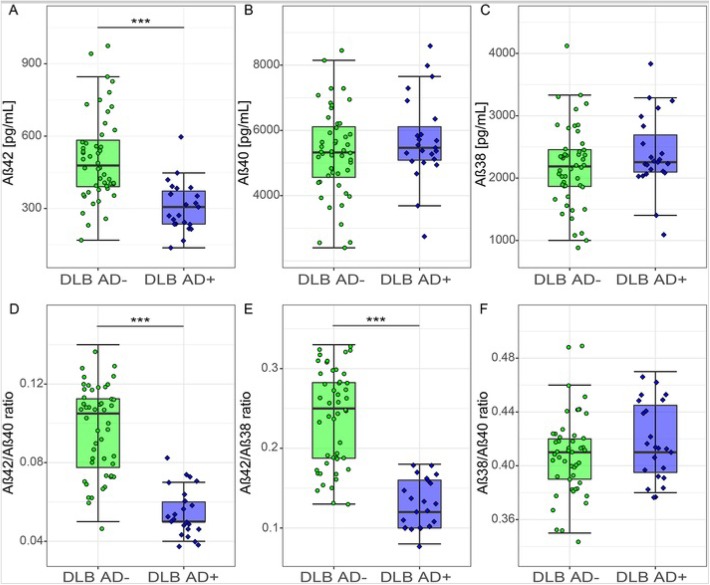
Fig. 3.
CSF Aβ peptides stratified by CSF tau/Aβ42 ratio in DLB. a CSF levels of Aβ42. b CSF levels of Aβ40. c CSF levels of Aβ38. d CSF Aβ42/Aβ40 ratio. e CSF Aβ42/Aβ38 ratio. f CSF Aβ38/Aβ40 ratio. The line through the middle of the boxes corresponds to the median and the lower and the upper lines to the 25th and 75th percentile, respectively. The whiskers extend from the 5th percentile on the bottom to the 95th percentile on the top. For visualization purposes, the AD and control groups are also presented. Differences between DLB AD− and DLB AD+ were assessed with ANOVA corrected for age and sex. *p < 0.05, **p < 0.01, ***p < 0.001

