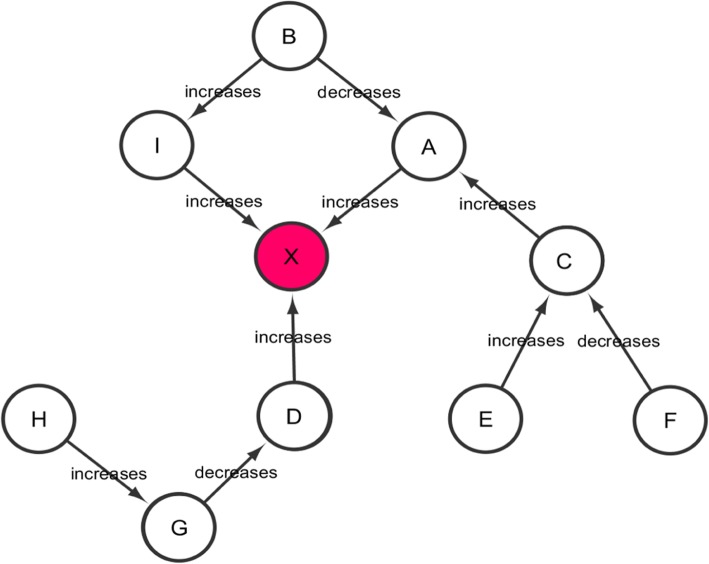
Fig. 1.
Mechanisms perturb with different intensities: a, b and c show the amplitude of mitochondrial dysfunction in PD across age-groups, PD stages and brain regions respectively. The CMPA scores observed to be high in age-group 40–50, Braak Stage 5–6 and cortex of PD patients. Similarly, d shows the perturbation of aggregation of NFTs in AD across different stages of AD. The CMPA scores are observed to be directly proportional with stages of AD

