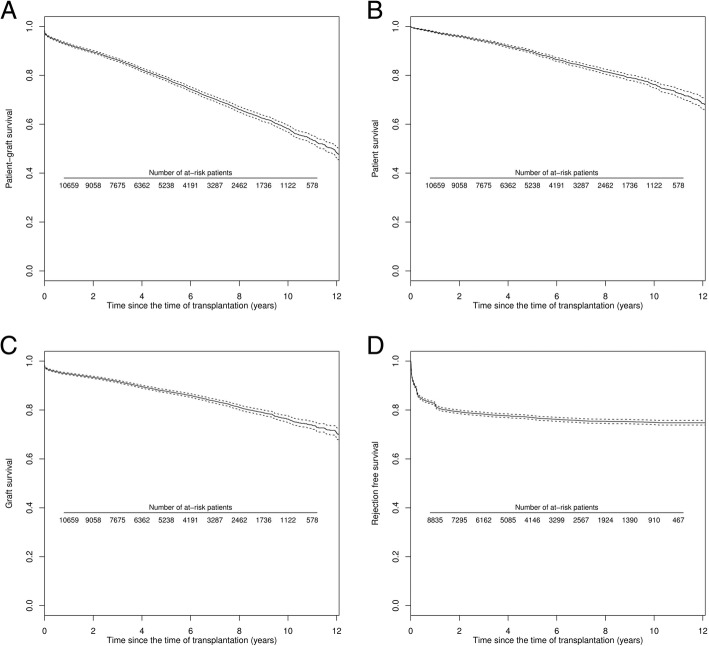
Fig. 3.
Survival curves according to the time of transplantation (n = 13,394) from Kaplan-Meier estimator (black lines) and their corresponding 95% CI (dotted lines). a Patient-graft survival; b Patient survival (with a functioning graft); c Graft survival (with death-censored); d Rejection free survival

