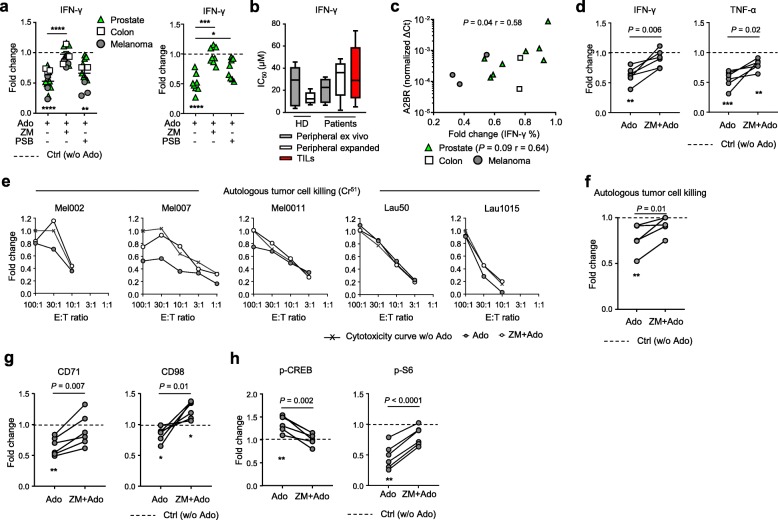
Fig. 4.
Ado impairs TIL effector functions and autologous tumor cell recognition. a Cumulative data of the fold change in CD8+ TIL IFN-γ production in the presence of the indicated combinations of Ado, A2AR agonist (CGS 21680) and A2AR/A2BR antagonists (ZM 241385 and PSB 1115, respectively) (n = 14). The left graph shows all the TIL samples analyzed, while the right graph only shows prostate-derived samples. b Cumulative data of the functional sensitivity (IC50 of IFN-γ production) to Ado measured in resting or expanded peripheral CD8+ T cells (n = 5) derived from HD or patients and in CD8+ TILs (n = 10) derived from patient tissues. The functional sensitivity was measured after overnight stimulation by anti-CD3/CD28-coated beads in the presence of decreasing concentrations of Ado. c Correlation between A2BR expression measured by qRT-PCR and the Ado-mediated fold change in IFN-γ production in CD8+ TILs. Spearman’s test, n = 13 (n = 8 for the prostate sample analysis). d Cumulative data of the fold change in IFN-γ and TNF-α production by TILs stimulated overnight by autologous tumor cells in the presence of Ado or ZM 241385 + Ado. (n = 6) e Each graph represents cytotoxicity curves for one patient quantified in the absence of Ado, in the presence of Ado or ZM 241385 + Ado. Data are presented as normalized to the cytotoxicity measured in the absence of Ado at the effector:target (E:T) ratio of 100:1. Cytotoxicity was measured by coincubating TILs for 4 h with autologous tumor cells; measurements were performed in triplicate. f Cumulative data of the fold change in cytotoxicity in the presence of Ado or ZM 241385 + Ado (n = 5). g Cumulative data of the fold change in CD71 and CD98 expression by TILs stimulated overnight by autologous tumor cells in the presence of Ado or ZM 241385 + Ado (n = 6). h Cumulative data of the fold change in p-CREB and p-S6 expression by TILs stimulated for 3 h by autologous tumor cells in the presence of Ado or ZM 241385 + Ado (n = 6). In all charts, each dot represents a patient, and the mean and standard error are presented. In all box charts, the 25th to 75th percentiles, the median and min-max of the values are presented; *P < 0.05, **P < 0.01, ***P < 0.001. Paired t test and/or one-way ANOVA tests

