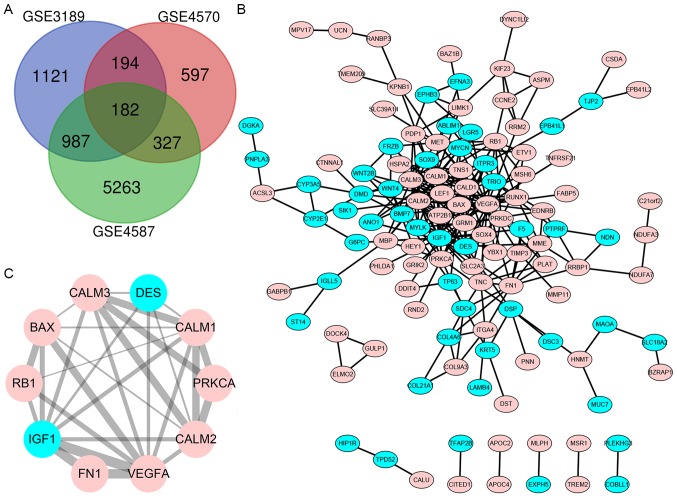
Figure 1.
Venn diagram of the three gene microarray datasets, PPI network obtained using bioinformatics algorithms and statistically significant DEG module. (A) DEGs with a fold change >2 and P<0.05 were selected among the gene expression profiling GSE4587, GSE3189 and GSE4570 datasets. A common set of 182 genes was identified at the intersection of the 3 datasets. (B) Cytoscape was used for the construction of the PPI network of the DEGs. (C) Module of maximum relevance, consisting of 10 nodes and 29 edges, extracted from PPI network. Genes with upregulated expression are shown in pink, whereas genes with downregulated expression are shown in blue. PPI, protein-protein interaction; DEG, differentially expressed gene; DES, desmin; VEGFA, vascular endothelial growth factor A, CALM1, calmodulin 1; CALM2, calmodulin 2; CALM3, calmodulin 3; FN1, fibronectin 1; PRKCA, protein kinase C α; IGF1, insulin-like growth factor 1; RB1, retinoblastoma transcriptional corepressor 1.

