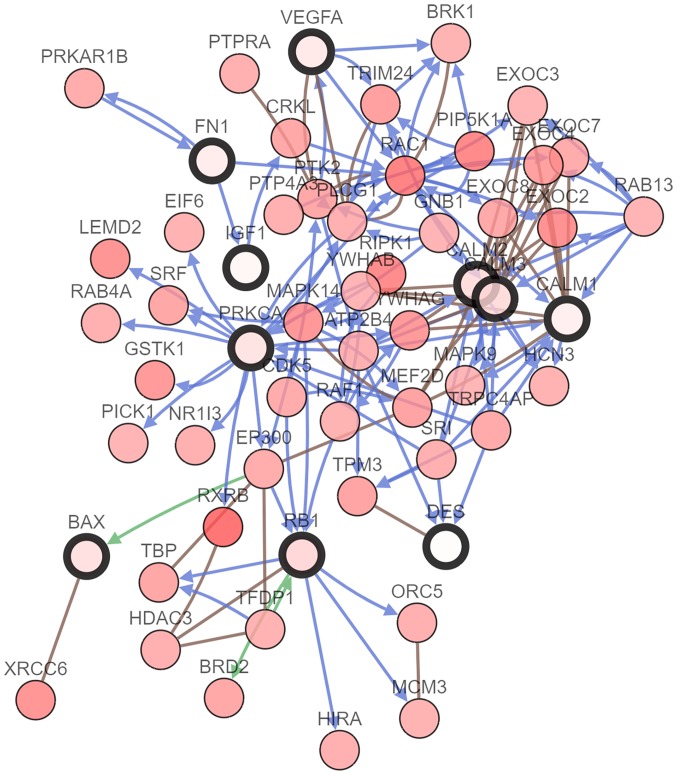
Figure 2.
Hub gene interaction network. cBioPortal was used to examine the hub genes and their co-expression genes. Blue arrows represent controlling state change of genes, green arrows represent controlling expression of genes and brown lines represent complex with other genes. Nodes with a bold black outline represent the hub genes, while nodes with a thin black outline represent co-expression genes. DES, desmin; VEGFA, vascular endothelial growth factor A; CALM1, calmodulin 1; CALM2, calmodulin 2; CALM3, calmodulin 3; FN1, fibronectin 1; PRKCA, protein kinase C α; IGF1, insulin-like growth factor 1; RB1, retinoblastoma transcriptional corepressor 1.

