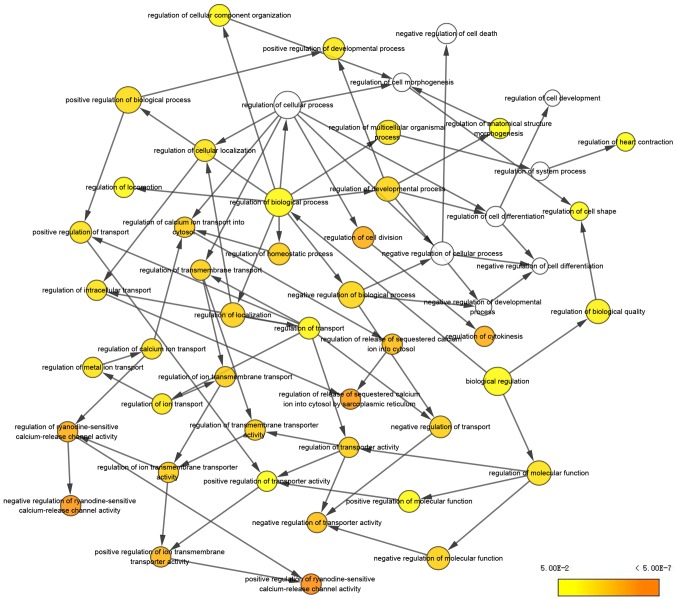
Figure 3.
BiNGO analysis of the biological process of genes with a degree ≥10. BiNGO was used for hub gene biological process analysis. The color depth of the nodes represents the corrected P-value of the ontologies. The magnitude of the nodes represents the genes that participate in the ontologies. BiNGO, Biological Networks Gene Oncology.

