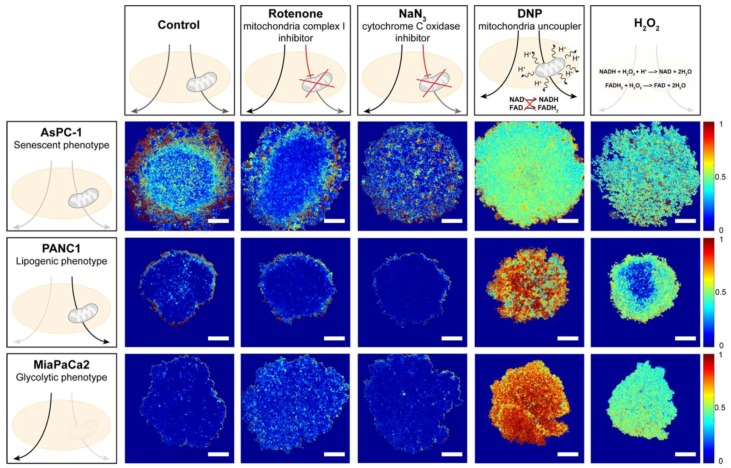
Figure 2.
Proof of concept of the redox imaging protocol; image analysis demonstrates the metabolic differences between spheroids of varying pancreatic cancer cell lines. Image analysis outputs demonstrating the optical redox ratio (ORR) spatial distribution throughout the tumor spheroids of PanCa cancer cell lines following exposure to modulators of the reduced nicotinamide dinucleotide (NAD(P)H) and oxidized flavoprotein adenine dinucleotide (NAD(P)H/FAD) balance as illustrated. Scale bar = 250 µm.

