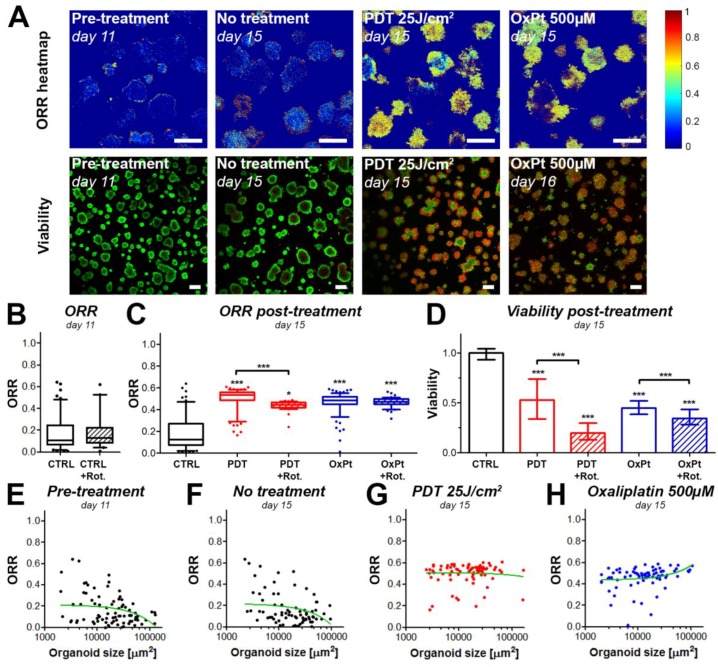
Figure 4.
The metabolic redox state in MIA PaCa-2 microtumors changes in response to photodynamic therapy (PDT) and chemotherapy. (A) ORR heatmaps and live/dead fluorescence images (live cells in green, dead cells in red) of the same cultures are depicted before and after treatment. Scalebar = 100 µm. (B) The box-whisker plot displays the median, 25th and 75th percentile, and the 90% confidence interval of the microtumor populations. (C) Quantification of the ORR of MIA PaCa-2 microtumors post-treatment (PDT or oxaliplatin chemotherapy (OxPt) with or without rotenone (Rot)). The box-whisker plot depicts the median, 25th and 75th percentile, and the 90% confidence interval of the microtumor populations. (D) As an auxiliary assay to the ORR determinations, viability of the microtumors was assessed post-treatment. The bars represent the mean ± 95% confidence interval of the microtumor populations. (E–H) ORR-size correlations are shown for the microtumors pre-treatment on day 11 (E), or on day 15 for the untreated control group (F), the 25 J/cm2 PDT-treated group (G), and the 500 µM oxaliplatin-treated group (H). In the scatter plots, the linear regression curve fit (in green) provides a qualitative indication of the size-ORR correlation. Data presented in panels A and E–H are from a single representative experiment, whereas the data plotted in panels B–D were obtained from 2–3 technical repeats with N = 3 wells containing ~700 individual microtumors/well. * p ≤ 0.05, *** , p ≤ 0.005.

