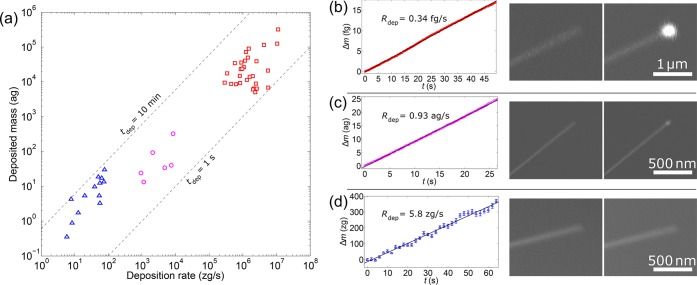
Figure 2.
(a) Deposition rate and deposited mass for all the fabricated devices with deposition times tdep in the range between 1 s and 10 min. The different operation modes are marked by different colors, and exemplary measurements are shown in (b–d). (b) Mass deposition in default GIS operation mode (GIS nozzle open, precursor in the chamber at a pressure in the range of p = (7–11) × 10–6 mbar). (c) Mass deposition in low-pressure mode (GIS nozzle closed, precursor residuals in the chamber with p = (1–1.7) × 10–6 mbar). (d) Mass deposition in the background vacuum regime (after more than 24 h of pumping, p = (0.8–1) × 10–6 mbar). The SEM images on the right show each nanotube before and after the deposition. The spring constants determined before and after the deposition are k = 6.2(5) × 10–7 N/m for (b), k = 1.57(7) × 10–5 N/m for (c), and k = 1.00(3) × 10–6 N/m for (d).

