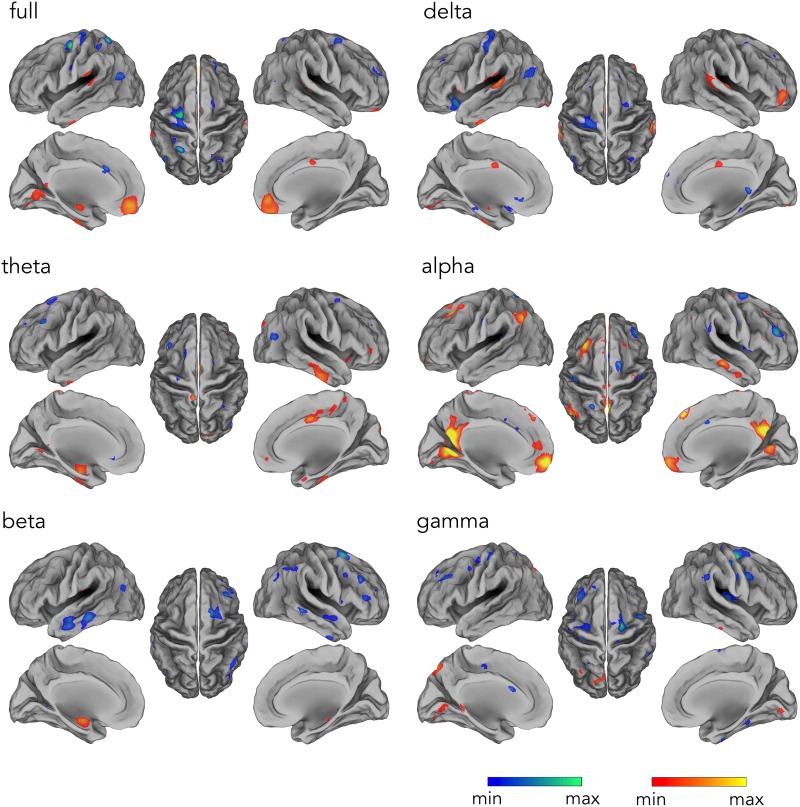
FIGURE 4.
Temporal profile of the hdEEG-derived DMN activity correlating with fMRI signals in delta (1–4 Hz), theta (4–8 Hz), alpha (8–13 Hz), beta (13–30 Hz), and gamma (30–80 Hz), and full (1–80 Hz) band. Group-level correlation maps between DMN time-course and voxel-by-voxel fMRI signals (n = 20, significance level p < 0.05 BY-FDR corrected).

