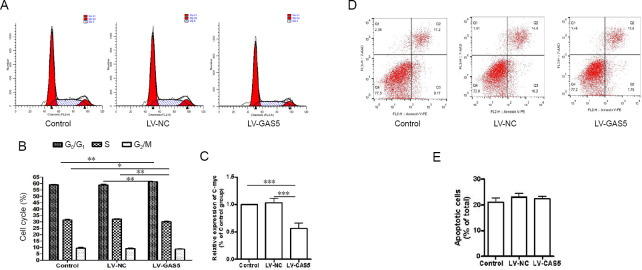
Figure 3.
Effect of growth arrest-specific 5 (GAS5) on cell cycle and apoptosis.
Detection of cell cycle progression and cell apoptosis using flow cytometry. (A, B) In the cell cycle assay, DNA histograms show propidium iodide fluorescence in different groups. (A) Proportion of cells at G0/G1 phase in the lncRNA GAS5-overexpressing lentivirus (LV-GAS5) group was obviously increased compared with the other two groups. In contrast, the ratio of cells in S phase in the LV-GAS5 group was clearly reduced compared with negative control lentivirus (LV-NC) and control groups. For G2/M phase, there were no differences among the three groups (B). (C) The C-myc gene can promote cell division; real-time polymerase chain reaction assay showed that relative levels of C-myc in the LV-GAS5 group were decreased compared with the other two groups. (D) Cell apoptosis was detected by flow cytometry analysis. (E) Apoptotic cell ratio (Annexin V single-positive cells vs. Annexin V/PI double-positive cells); there were no differences among groups. Data are expressed as the mean ± SEM. *P < 0.05, **P < 0.01, ***P < 0.001 (one-way analysis of variance followed by independent sample t-test). The experiment was repeated three times.

