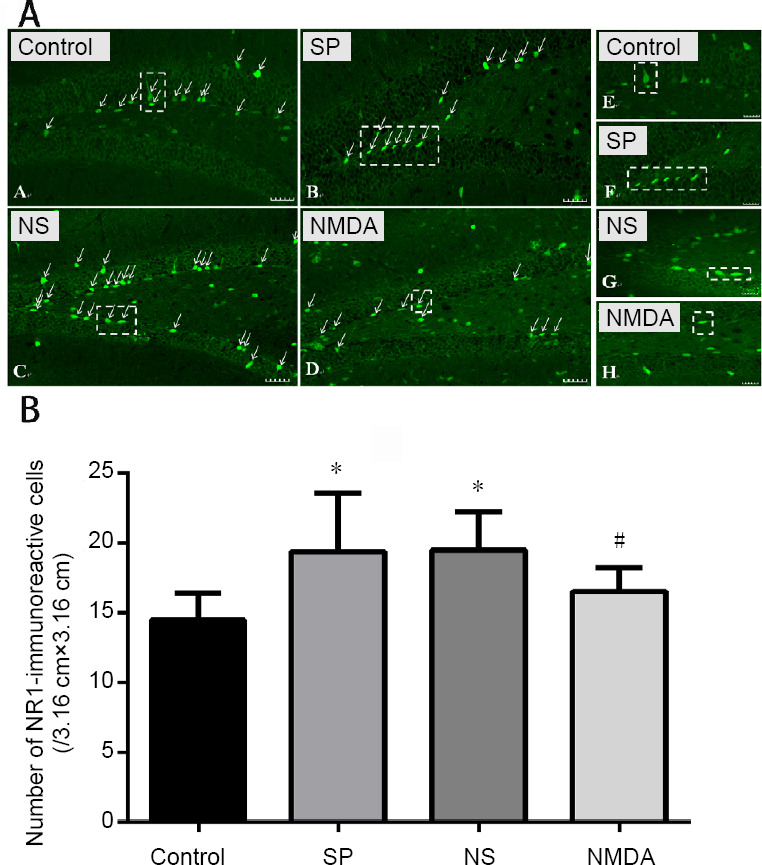
Figure 2.

Effect of NMDA on the immunoreactivity of NR1 in the hippocampal dentate gyrus of a schizophrenia-like mouse.
(A) NR1-immunoreactive cell (green, Alexa Fluor 488 labeled) in the hippocampal dentate gyrus. The arrows point to the NR1-immunoreactive cell. Scale bars: 40 μm. The right virtual frame (E–H) is an enlarged version of the left virtual frame (A–D). (B) The number of NR1-immunoreactive cells in the hippocampal dentate gyrus in each group. The histogram data range is the average number of immunoreactive cells in each slice of each group. All data are shown as the mean ± SD (n = 10). *P < 0.05, vs. control group; #P < 0.05, vs. SP or NS group (oneway analysis of variance followed by least significant difference test). CON: Control; SP: schizophrenia; NS: normal saline; NMDA: N-methyl-D-aspartate; NR1: NMDA receptor subunit.
