
Figure 5.
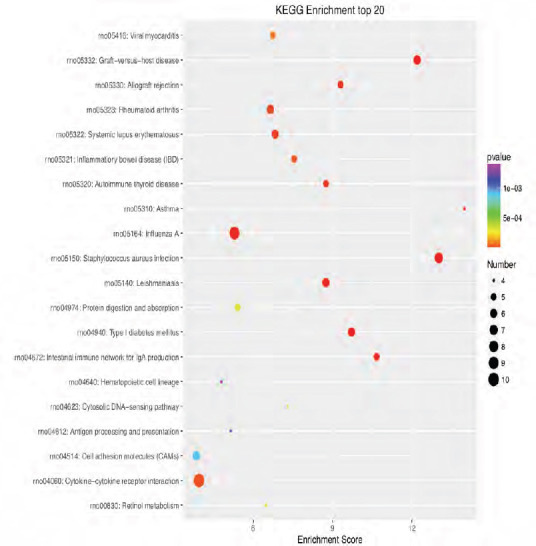
KEGG enrichment analysis of the 20 most highly differentially expressed genes between tibial and common peroneal nerves 7 days after surgery.
The signaling pathways involved include the Chemokine, B cell receptor, Toll-like receptor, and nuclear factor-kappa B signaling pathways. The X-axis is the enrichment score. The larger the bubble, the larger the number of differentially expressed genes. The color of the bubble changes in the order red-blue-green-yellow, with increasing in P-value enrichment. KEGG: Kyoto encyclopedia of genes and genomes.