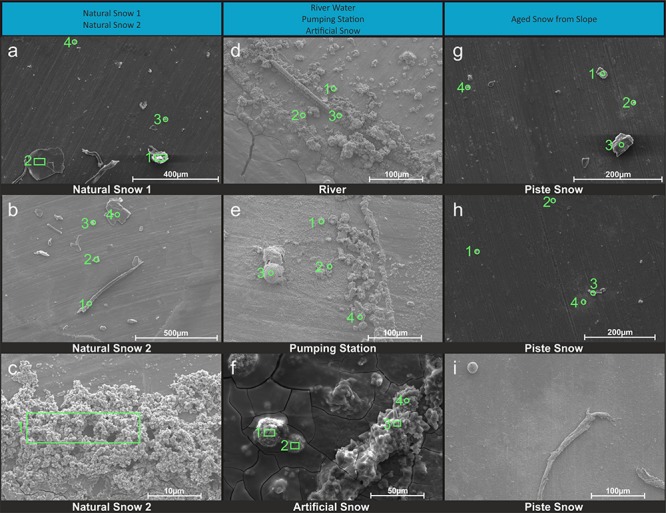
FIGURE 4.

SEM images of snow and water sample residues. Green circles indicate where EDX single spot spectra were taken (1 mm diameter) and green rectangles indicate where larger areas were scanned for a spectrum. A column represents a group of related samples with the black bar under each image indicating which specific sample is shown. Images (a–c) are natural snow samples, (d–f) are samples derived from the riverwater and (g–i) are different spots on the aged snow. The associated elemental information is summarized in Table 3.
