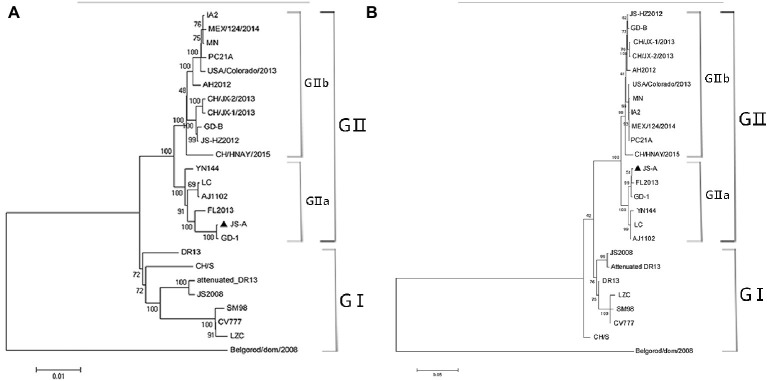
Figure 2.
Phylogenetic analysis was performed using the nucleotide sequences of the complete genome (A) and S genes (B) of the PEDV strain from the GenBank database. JS-A is represented by a triangle. The phylogenetic tree was constructed by the adjacency method in MEGA 7 (http://www.megasoftware.net). Bootstrap analysis was performed using 1,000 iterations and the bootstrap value was indicated on each branch. Scale bar indicates nucleotide substitution at each site.

