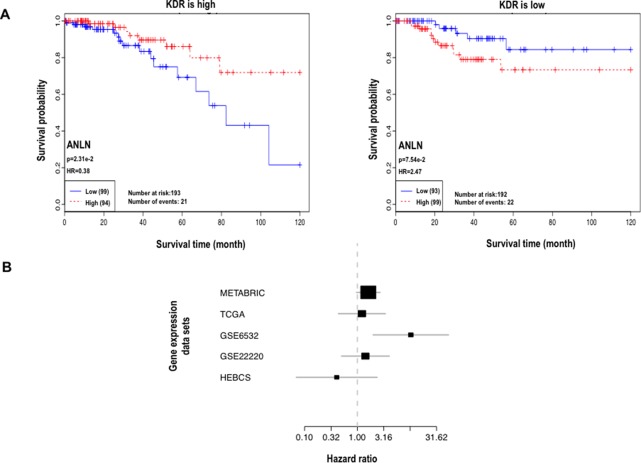
Figure 1.
Analysis of interactions between ANLN and KDR. (A) Kaplan–Meier plot at the protein expression level. (B) Forest plot at the gene expression level. In the forest plot, each line represents the confidence interval of a study, where a longer line represents a smaller dataset; each black box represents a point estimation, where a larger area represents a higher weight the dataset contributes to the meta-analysis.

