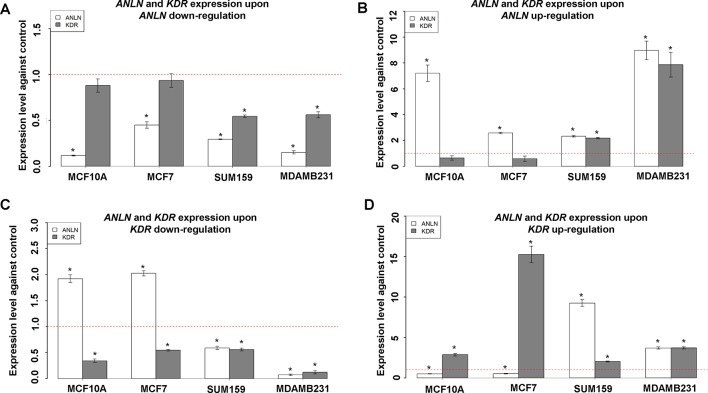
Figure 3.
Interactions between ANLN and KDR in different breast cancer cells. (A) KDR gene expression after downregulating ANLN in each cell line. (B) KDR gene expression after upregulating ANLN in each cell line. (C) ANLN gene expression after downregulating KDR in each cell line. (D) ANLN gene expression after upregulating ANLN in each cell line. Bars represent mean ± SD from at least three independent experiments. * represents statistical significance (p < 0.05) from Student’s t test. The red dotted line represents the expression level where no external modulation was done. SUM159 and MDAMB231 are triple negative breast cancer cells, MCF7 is a luminal breast cancer cell line, and MCF10A represents normal breast epithelial cells.

