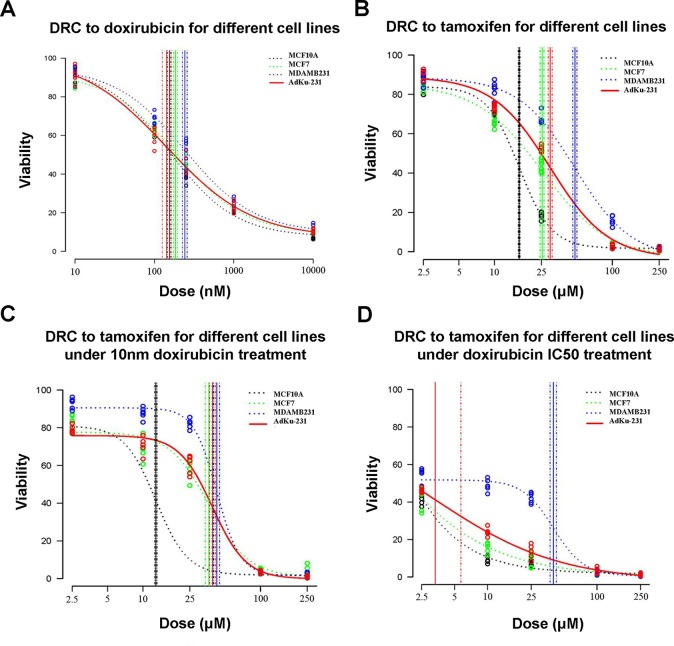
Figure 5.
Comparison on cell viabilities in response to Tamoxifen, Doxirubicin, and combined use of Tamoxifen and Doxirubicin among different cell lines. Drug response curves under the treatment of (A) Tamoxifen, (B) Doxirubicin, (C) combined used of Tamoxifen and 10 nm Doxirubicin, and (D) combined use of Tamoxifen and IC50 Doxirubicin. AdKu-231 was used in this figure.

