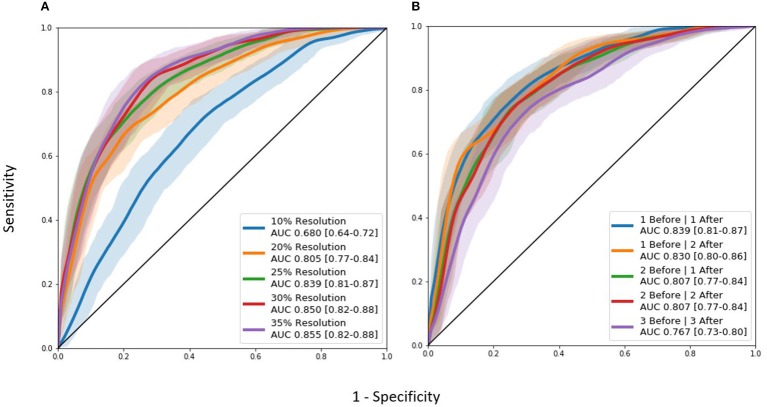
Figure 4.
AUC ROC curves for hyperparameter tuning experiments: (A) Image resolution experiments. (B) Differing Inception module architecture experiments. “Before” and “after” labels represent the number of 3D Inception modules before and after the L-1 layer where the two timepoints are combined together.

