
Figure 5.
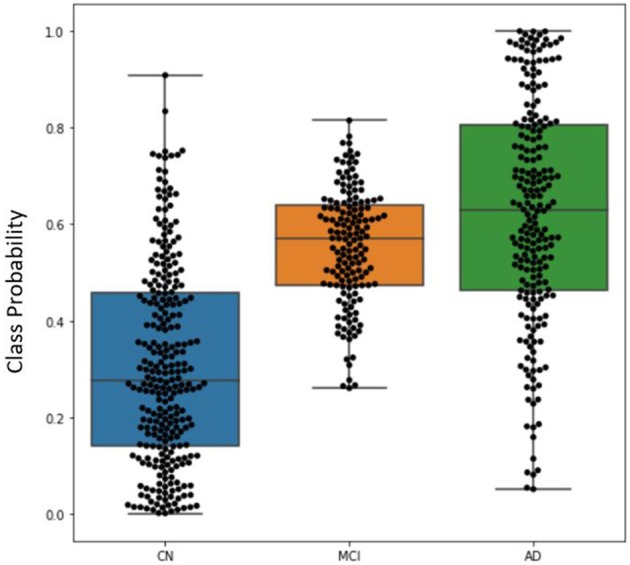
Boxplot visualizing the distribution of DeepSymNet's output probabilities for the three classes, where each dot represents the progression probability for one subject. The class probability can be used as an indicator of AD-like longitudinal progression over two timepoints.