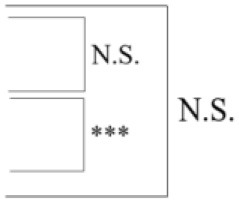
Table 3.
Longitudinal models' metric evaluation for AUC ROC, sensitivity, specificity, and balanced accuracy on the full dataset.
| Model | AUC ROC | Sensitivity | Specificity | Balanced accuracy | |
|---|---|---|---|---|---|
| FS 2 (n = 482) | 81.0 | 75.9 | 71.9 | 72.3 |  |
| DeepSymNet (n = 482) | 83.9 | 79.2 | 72.9 | 75.7 | |
| Voxel-based random forest (n = 482) | 76.7 | 68.4 | 72.6 | 64.2 |
p-values were computed from the DeLong test for correlated ROC curves to reject the null hypothesis that there is no statistical difference between the AUCs.
N.S., not significant.
***p <0.0001.
