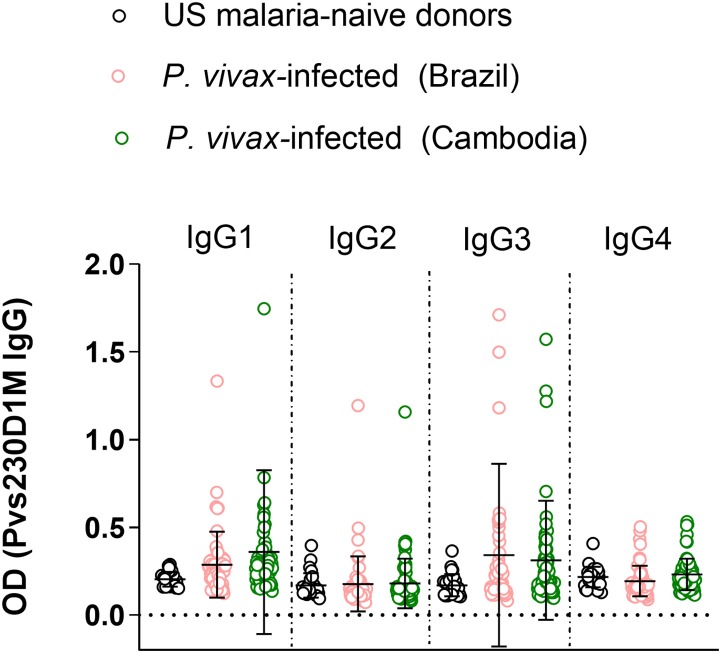
Figure 3.
Immunoglobulin G subclass responses to Pvs230D1M in Brazil and Cambodia. Healthy malaria-naïve donor sera were used to define the background for each subclass, and cut-off was calculated based on mean control + 3 standard deviations. IgG3 and IgG1 responses were predominant with limited IgG2 and no IgG4 response. One-Way ANOVA followed by multiple comparisons was used for this analysis and results are displayed as mean ± SD.

