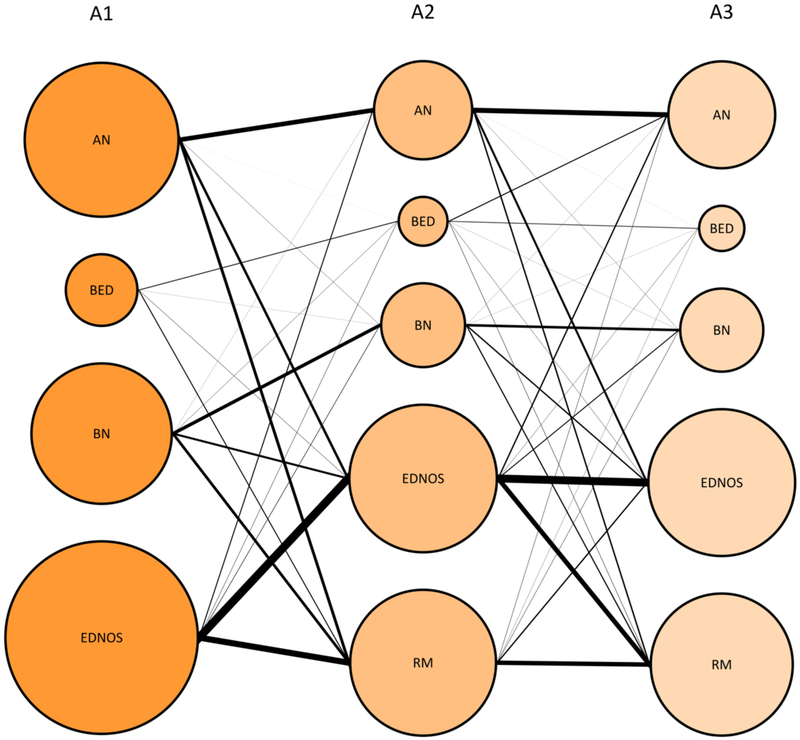
Figure 1.
Plot showing transitions among the eating disorders across the first three assessment points (A1-3). Size of the bubbles indicate the proportion of individuals presenting with each diagnosis, within each assessment point. The width of a line between two diagnoses represents the share of the total flow between two assessment points. AN = anorexia nervosa, BED = binge-eating disorder, BN = bulimia nervosa, ENDOS = eating disorder not otherwise specified, A1-A2: n = 9622, A3: n = 3499.

