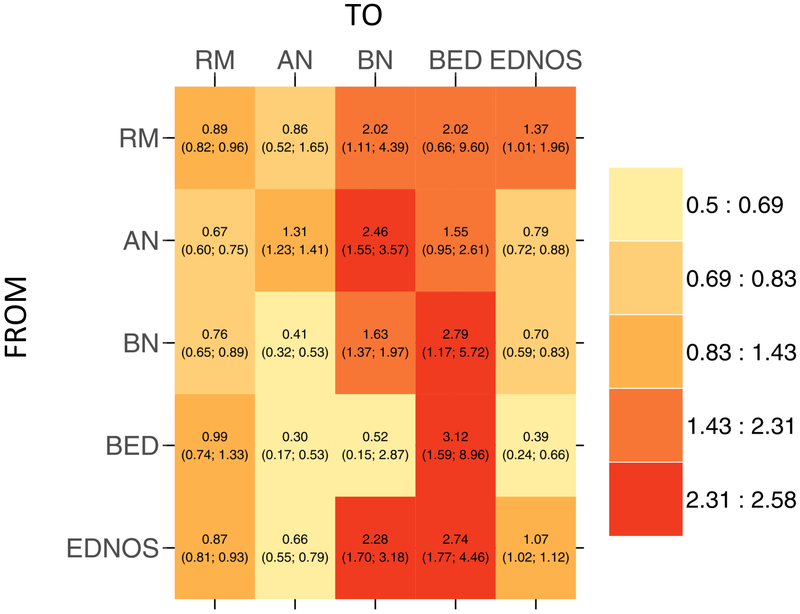
Figure 3.
Heat map showing transitions among the eating disorders comparing younger and older cohorts. Ratios less than one indicate that transition is more likely in the younger cohort; ratios greater than one indicate that transition is more likely in the older cohort. AN = anorexia nervosa, BN = bulimia nervosa, BED = binge-eating disorder, ENDOS = eating disorder not otherwise specified; RM = remission.

