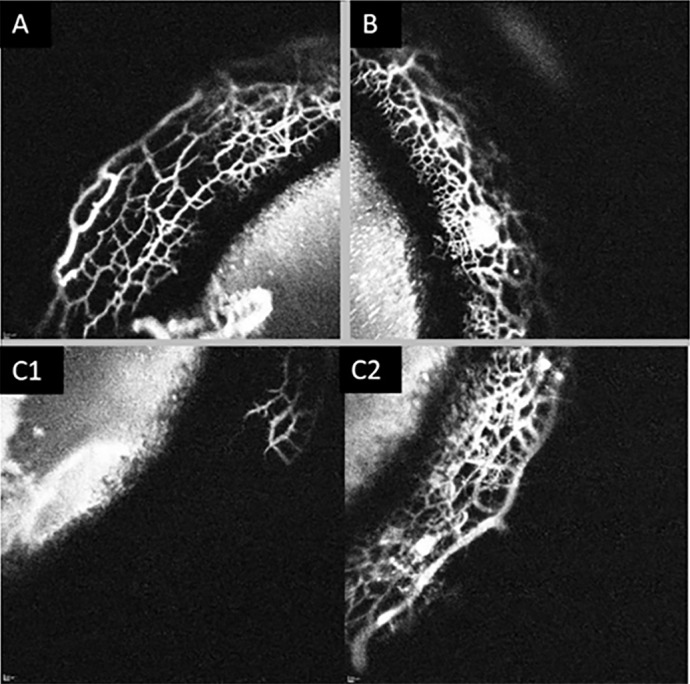
Figure 3.

Segmental outflow in a normal feline eye. Images of three quadrants (A–C) from the same eye taken at approximately 7 minutes post 0.4% ICG injection. (A, B) Depict high-angiographic signal and (C1) depicts no signal. (C2) depicts the same quadrant as in (C1), imaged at 20 minutes postinjection of tracer, which now exhibits an angiographic signal.
