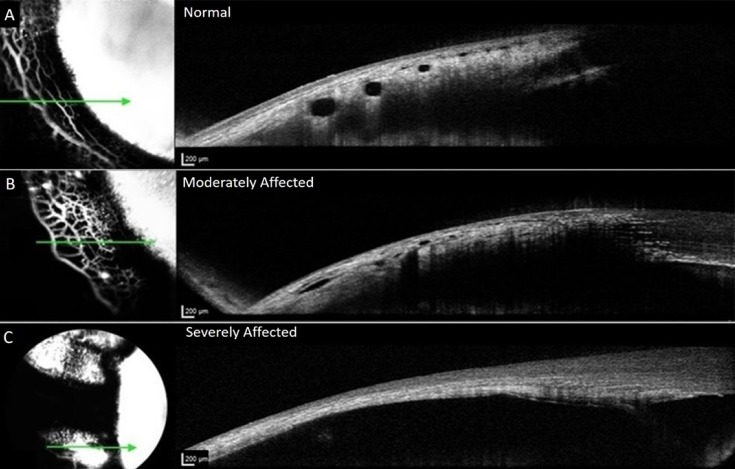
Figure 4.
Representative OCT images from normal and glaucomatous feline eyes. Images on the left represent en face confocal laser scanning ophthalmoscopy images of AA signal and images on the right are corresponding, OCT line scans registered to these images *Green arrow corresponds to precise location of OCT line scan. (A) Depicts normal eye; (B) depicts globe affected by glaucoma. OCT lumens visible but appear attenuated. (C) Depicts severely affected glaucoma eye with no vascular outflow signal, or scleral lumens visible on the corresponding OCT image. The sclera is thin and no scleral vessel lumens are visible. Angiographic signal on the left represents combination of diffusion into overlying conjunctival tissues after extended period of time and possibly signal visible from within, through extremely thin sclera.

