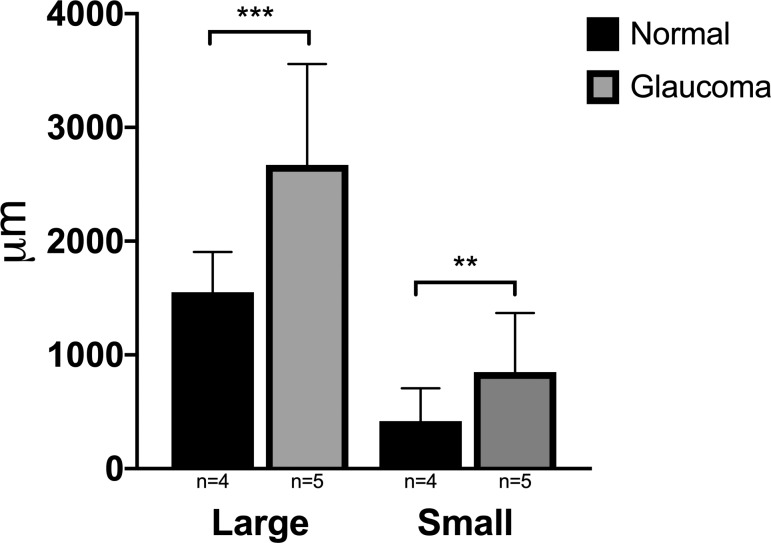
Figure 8.
Mean distance in micrometers from the termination of Descemet's membrane to first large and small vessel lumen, comparing normal and glaucoma groups from histologic sections. These distances were significantly greater in eyes with glaucoma than in normal eyes (P ≤ 0.0001 and P = 0.001, respectively). Error bars represent standard deviation.

