Figure 2.

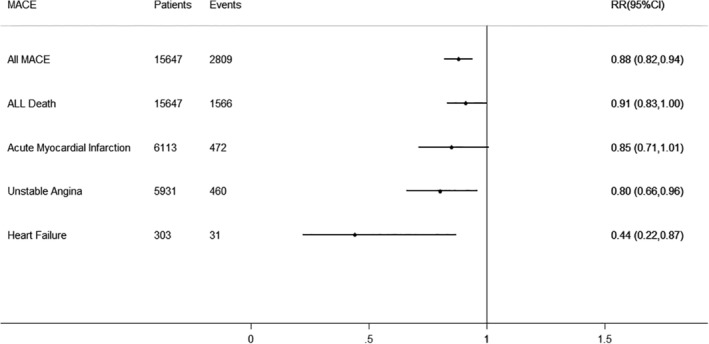
Interleukin‐1 Blockade treatment and Cardiovascular Risk. The dotted line in the forest plot represents fixed‐effects summary risk estimate

Interleukin‐1 Blockade treatment and Cardiovascular Risk. The dotted line in the forest plot represents fixed‐effects summary risk estimate