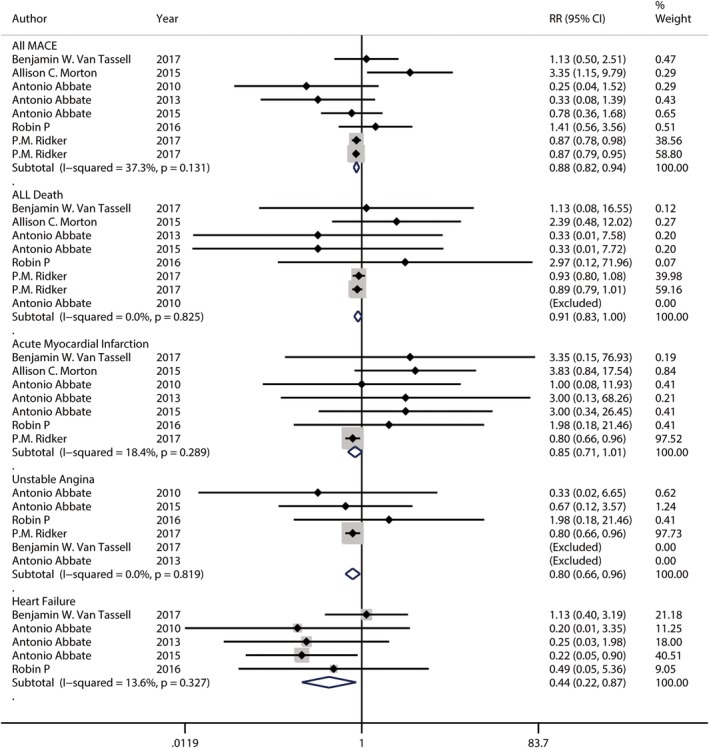
Figure 3.

Forest plot showing relative risks of overall major adverse cardiovascular events, death from any cause, acute myocardial Infarction, unstable angina and breakthrough or recurrence of heart failure. The size of each square is proportional to the study's weight (inverse of variance). The dotted line in the forest plot represents fixed‐effects summary risk estimate
