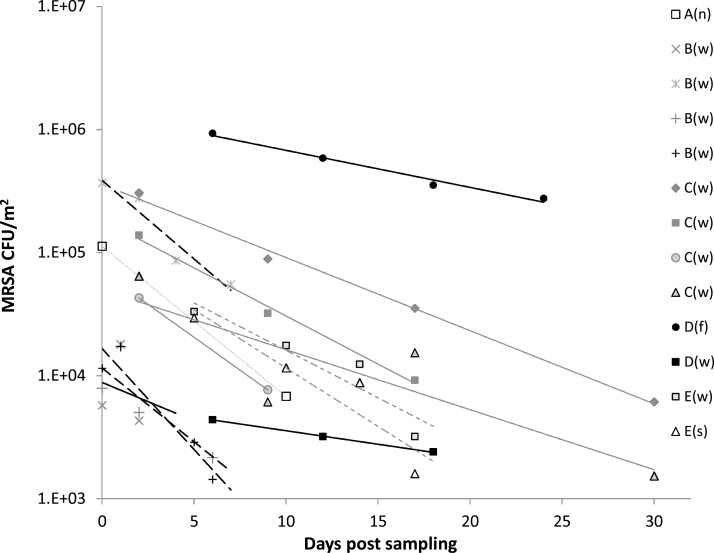
Figure 1.
Survival of MRSA in swine stable dust following storage as determined by CFU of MRSA on MRSA 2 agar plates. The symbols represent the mean of EDC samples (n = 1–3, Table 1) collected from each of the farm stable sections at different sampling occasions. Capital letters represent data from the five MRSA-positive farms, and letters in brackets designate the type of stable section: (n) nursing, (w) weaning, (f) farrowing, and (s) slaughter. For Farms A to E, the following symbols are used for the regression lines: A: ---; B: ----; C: — ; D: — ; E:-----.

