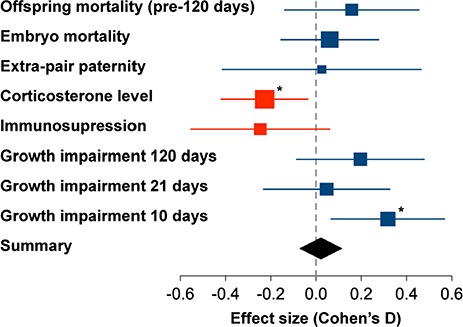
Figure 3.

Effect size of each measured parameter for individuals in noise. Data points give the mean estimates of the models with 95% confidence intervals (1.96*SE). To make all effects comparable, variables were modelled as normally distributed, and all dependent variables were scaled to a standard deviation of 1 (scaled values can be found in Table S1, in the electronic supplemental materials). For illustration, the sign of the effect of noise was standardized such that we expected to obtain values >0 (e.g. the effect on offspring mass was multiplied by −1 in order to reflect growth impairment rather than growth). Data point size reflects the sample size. Red symbols indicate effects that were opposite to expectations. Asterisks indicate significance, without correction for multiple testing.
