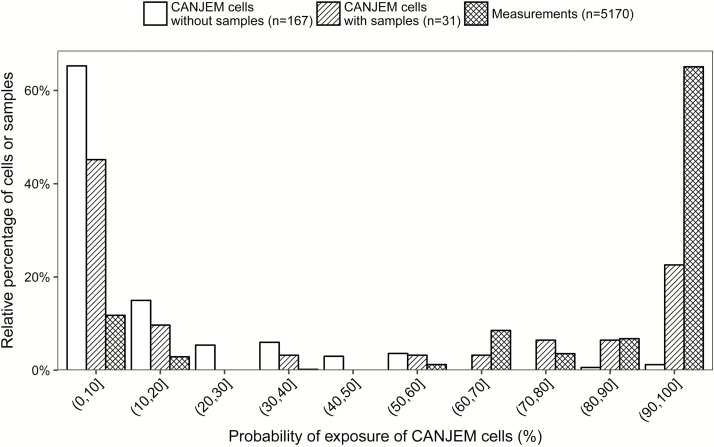
Figure 1.
Distribution of the 198 CANJEM cells with at least one exposed job by probability of exposure, stratified by the availability of measurements (minimum of 10 samples per cell), and distribution of the measurements by the probability of exposure of the occupation in the 31 CANJEM cells with samples.

