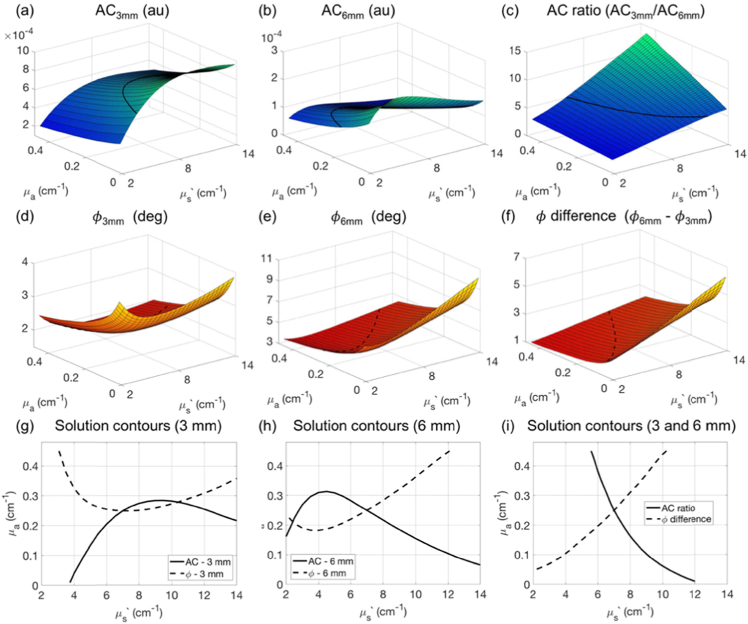
Fig. 1.
Monte Carlo-based lookup table for small separation FDNIRS. Monte Carlo simulated AC amplitude at ρ = 3 mm (a), ρ = 6 mm (b), and the ratio of AC at 3 versus 6mm (c), as well as phase shift (ϕ) at ρ = 3 mm (d), ρ = 6 mm (e), and the phase difference between 3 and 6 mm (f) as a function of absorption and reduced scattering coefficient of the tissue (μ a and μs′, respectively). The black lines in (a-f) depict representative isolines of AC (solid) and phase (dashed) that we project onto the μs′-μa axis in (g-i). The iso-phase and iso-amplitude lines from a single separation (g,h) intersect at multiple points, whereas the iso-AC ratio and iso-phase difference contour lines form a unique intersection point (i).

