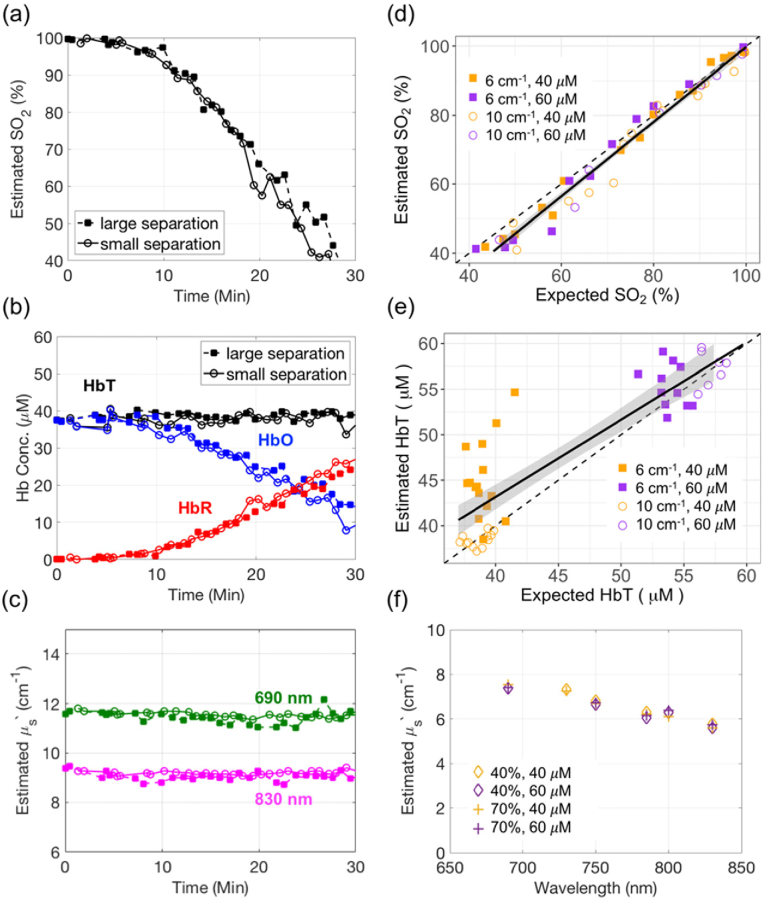
Fig. 4.
Blood-mixed liquid phantom verification (a-c) Representative time traces of oxyhemoglobin (HbO, red), deoxyhemoglobin (HbR, blue), total hemoglobin (HbT, black), oxygen saturation (SO2) and reduced scattering coefficients at 690 (green) and 830nm (magenta) estimated by small separation FDNIRS (solid rectangle) and by large separation FDNIRS (hollow circles) during blood phantom deoxygenation. (d-e) Comparison of small separation FDNIRS with expected large-separation FDNIRS HbT (d) and SO2 (e) across four blood phantoms with target HbT of 40 μM (orange) or 60 μM (purple) and target μs′(785 nm) of 6 cm-1 (solid rectangles) or 10 cm-1(hollow circles). The black dotted lines in (d,e) denote the line of unity, the black solid lines denotes the line of best linear fit, and the grey shaded regions denotes the confidence interval of the linear fit. (f) Four representative μs′ spectra measured by small separation FDNIRS on a blood phantom (target μs′(785 nm) of 6 cm-1) where HbT was varied from 40 to 60μM (orange and purple, respectively) and SO2 was varied from 40 to 70% (diamond and cross, respectively).

