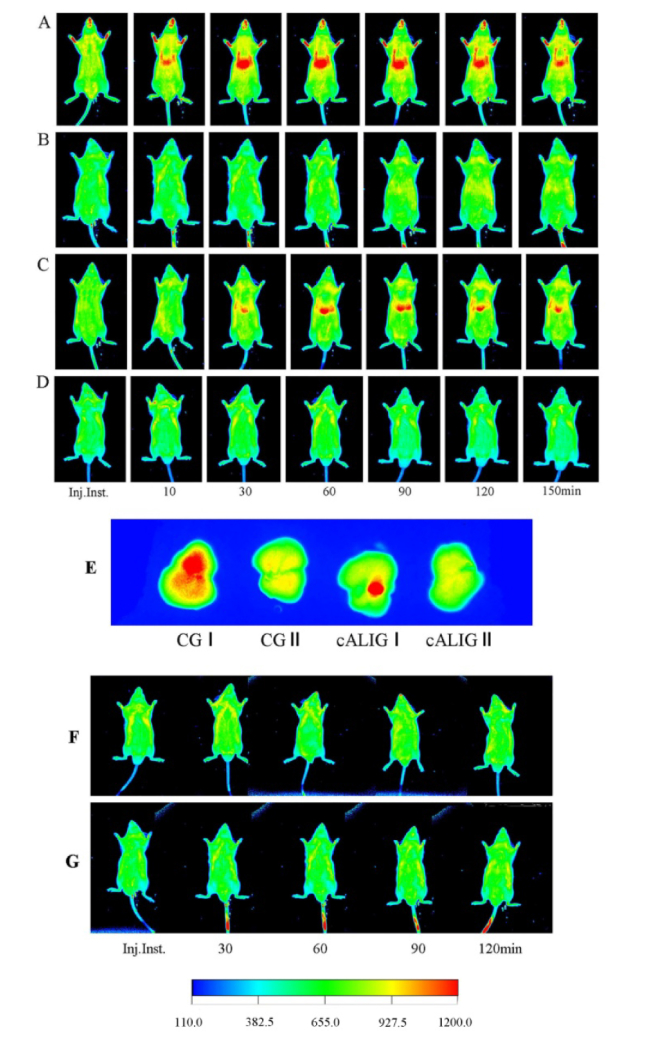
Fig. 1.
Targeted visualization of ASGPR by IVFI with Cy5.5-GP. On IVFI, the red area in the middle of the mouse abdomen indicates Cy5.5-GP binding with hepatocyte ASGPR. Inj. inst.: Immediately after Cy5.5-GP injection. A: Cy5.5-GP IVFI, CG I (n = 10). After Cy5.5-GP injection, slow aggregation of fluorescence in the liver was observed; from 10-30 min, the FI gradually increased; from 30-60 min, the FI reached the highest level, and the FA was the largest; from 60-90 min, the FI and FA were stable; at 120 min, the FI was slightly decreased, and the FA was decreased; at 150 min, the FI was significantly attenuated. B: Cy5.5-GP IVFI, CG II (n = 10). There was no fluorescence signal aggregation in the liver at any point. C: Cy5.5-GP IVFI, cALIG I (n = 10). From 30-150 min, the fluorescence distribution characteristics in the liver were similar to that in CG I; however, the FA was significantly lower than that in CG I. D: Cy5.5-GP IVFI, CG II (n = 10). The results are consistent with those observed in CG II. E: IVFI of the liver lobe at 60 min after Cy5.5-GP injection; n = 2 animals in each group. The FI was highest in CG I, followed by cALIG I, CG II and cALIG II. F: Cy5.5 IVFI, CG III (n = 5). G: Cy5.5 IVFI, cALIG III (n = 5). There was no fluorescence signal aggregation in the liver at any time point in the latter two groups. The color index was intensity scale.

