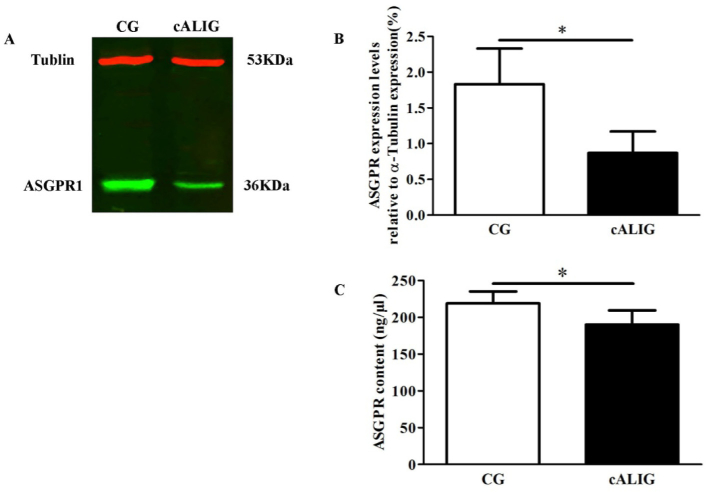
Fig. 3.
ASGPR expression in the liver tissue of healthy mice (CG I) and cALI mice (cALIG I). A: ASGPR expression in hepatocytes determined by Western blot analysis. ASGPR and tubulin expression in CG (lane 1) and cALIG (lane 2); n = 10 animals in each group. B: Densitometric analysis of the Western blot results of ASGPR expression based on tubulin expression; n = 10 animals in each group. C: Densitometric analysis of ASGPR expression by ELISA; n = 10 animals in each group. (*P < 0.05 vs CG; LSD two-group comparison test). The data are shown as the mean ± SD.

