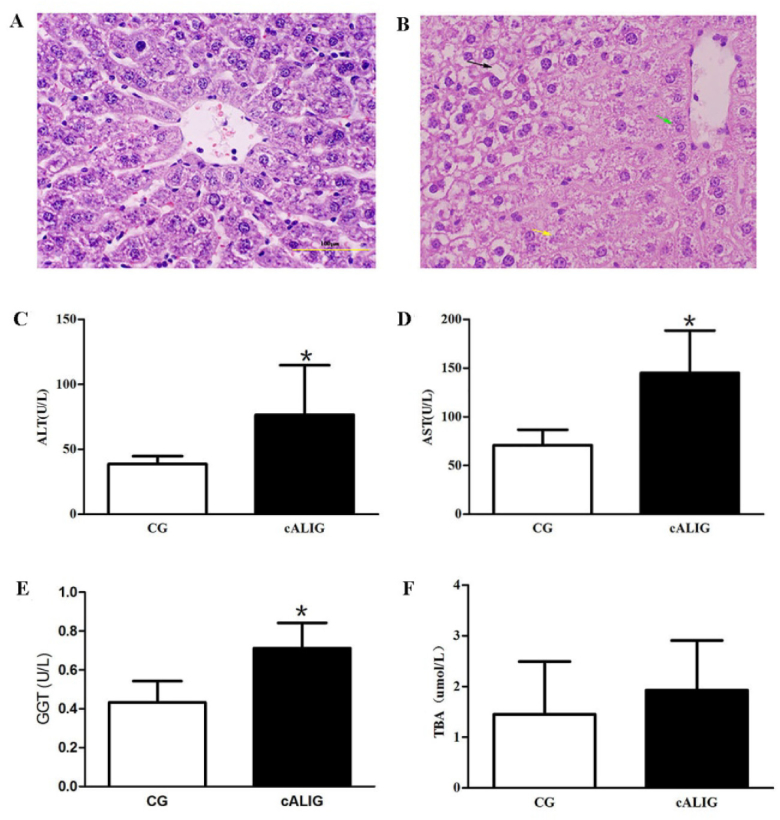
Fig. 4.
Comparison of liver histology and serum marker levels. A and B: H&E staining of liver tissue (10×); scale bar: 100 µm, A was CG I, B was cALIG I; n = 10 animals in each group. The black arrow indicates steatotic hepatocytes, the yellow arrow indicates necrotic hepatocytes, and the green arrow indicates swollen and distended hepatocytes. C: Comparison of the ALT level between CG I and cALIG I; n = 10 animals in each group. D: Comparison of the AST level between the two groups; n = 10 animals in each group. E: Comparison of the GGT level between the two groups; n = 10 animals in each group. F: Comparison of the TBA level between the two groups; n = 10 animals in each group. (*P < 0.05 vs CG; LSD two-group comparison test). The data are shown as the mean ± SD.

