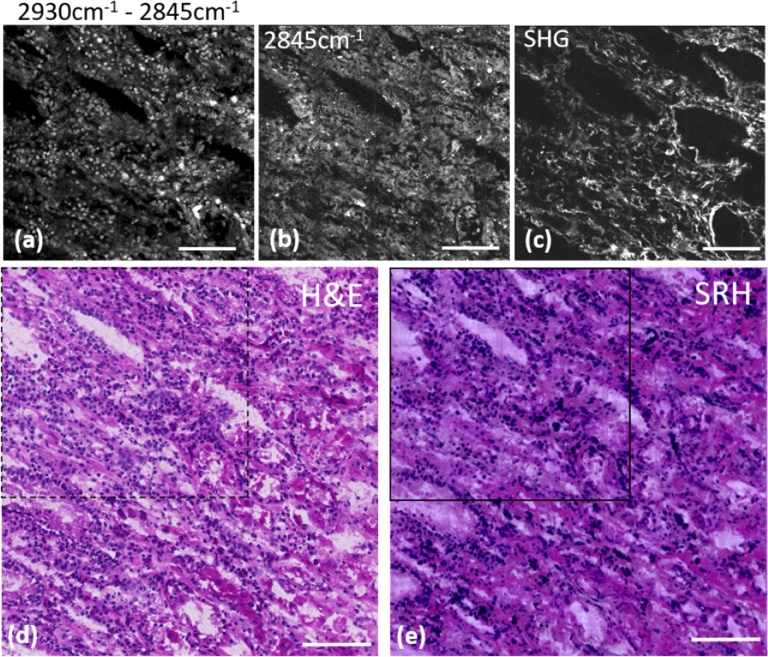
Fig. 1.
One to one SRH/H&E comparison on a 8 µm thick cryogenic slide of muscosa from human stomach. (a) Built image of SRS2930cm-1 – SRS2845cm-1 displaying the nuclei distribution of the region highlighted with the black squares in the H&E (dashed square) and SRH (solid square) images; (b) SRS image at 2845cm−1 highlighting the cell body distribution of the same region; (c) SHG image providing the collagen distribution of the same region. (d) H&E staining of a larger region (0.6mmx0.6mm) of the same cryogenic slide. (e) SRH image built using (a, b and c) displaying the same extended region as in (d) and demonstrated similar features. Scale bar is 100 µm.

