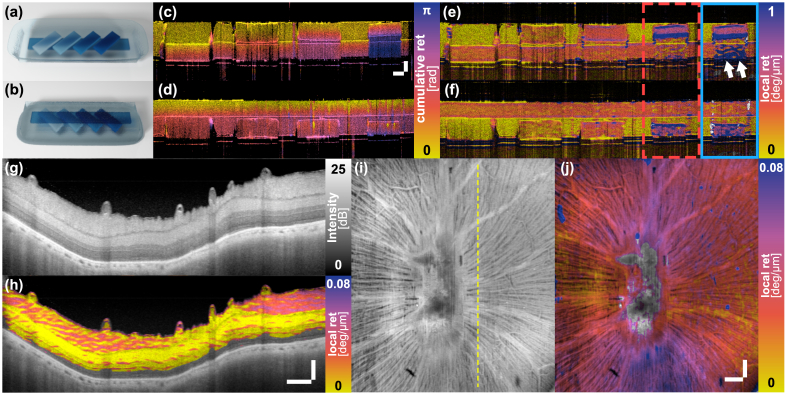
Fig. 4.
Local retardation imaging of birefringence phantom and swine retina ex vivo using the polarization mirror state constraint. (a, b) Schematic sketch of the two-layer phantom sample in either orientation. (c, d) Corresponding cumulative retardation and (e, f) local retardation images, respectively. The blue box displays the local retardation image of the sample area within the red dashed box reconstructed without spectral binning. The alignment of the polarization state with the mirror state caused by the first birefringent element leads to an overestimation of the birefringence in the second layer (white arrows). Scale bars in (c) measure 100 µm (vertical) and 400 µm (horizontal). (g) Cross-sectional intensity image of swine retina. (h) Cross-sectional local retardation image. Scale bars in (h) measure 100 µm (vertical) and 400 µm (horizontal) and apply to (g, h). (i) Intensity and (j) local retardation en face projections of the RNFL layer of the swine retina. The dashed line in (i) indicates the location of the cross-section in (g, h). Both scale bars in (j) measure 400 µm and apply to (i, j). Sample areas in (h) and (j) with a are masked.

