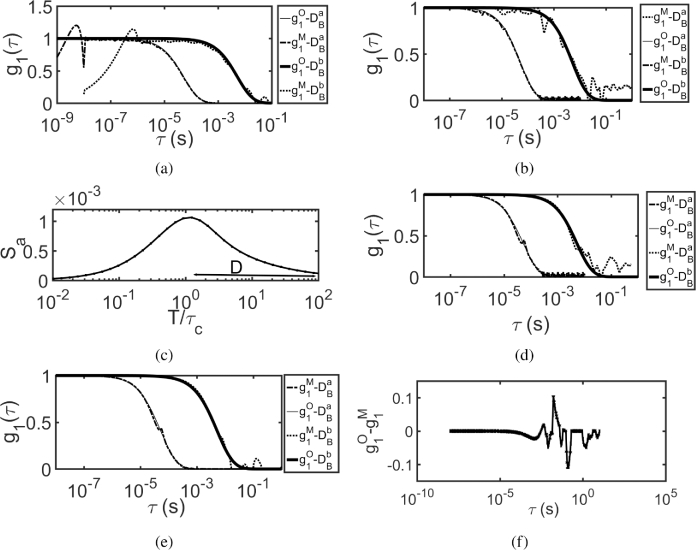
Fig. 8.
Recovered at r = 1 cm using MVIM, from for (a) without prior information i.e., (b) with prior information i.e., ; (c) Sensitivity curve is plotted as a function of [42], where was chosen as time , when . From this curve it can be seen that maximum sensitivity is achieved, when ; Recovered from by (d) using optimal exposure range i.e., (e) iterative scheme; (f) Residual between original and recovered using iterative scheme. Here the superscript M in the legend indicates that it is MVIM recovered and O indicates that it is original

