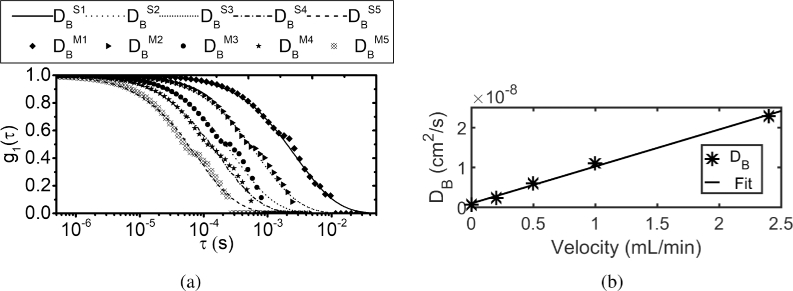
Fig. 14.
(a) Recovered using the proposed method and based on SCOS fit for different flows is plotted. The shift of the curve from the right to left indicates the increase in flow. (b) MVIM fitted values plotted against the velocity of the syringe pump. It can be seen that as the velocity of the flow increases, the value also increases linearly.

