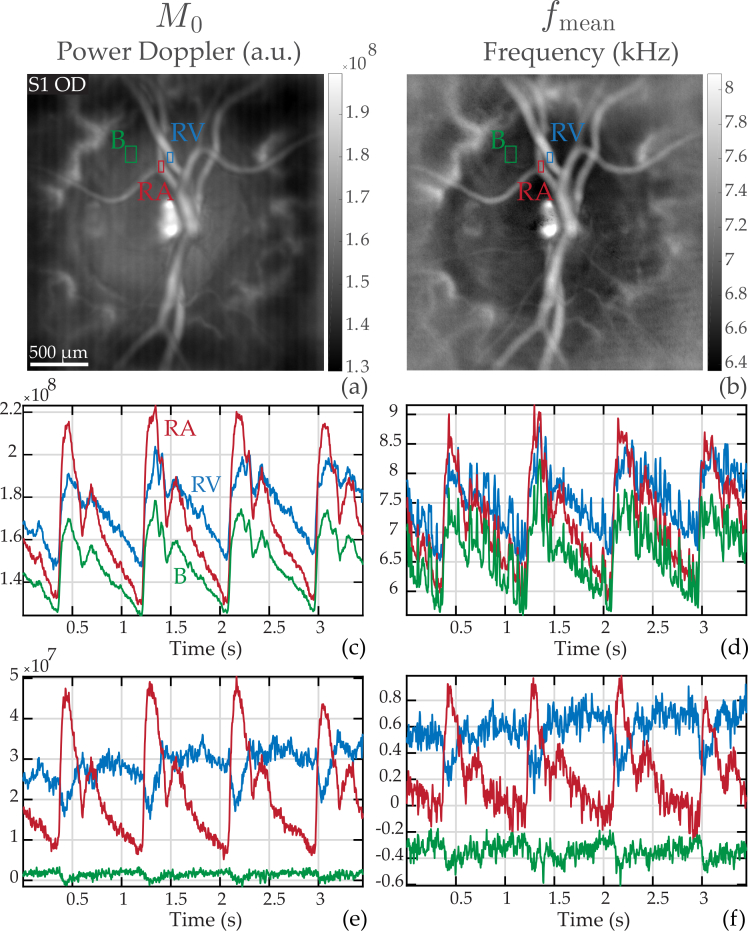
Fig. 1.
Analysis of the dynamic changes in power Doppler signal and mean Doppler frequency shift, which supposedly yield volume and velocity, respectively. (a) and (b): power Doppler image M0(x, y) and mean frequency shift fmean(x, y) temporally averaged; the red, blue, and green ROIs mark a retinal artery (RA), a retinal vein (RV), and the background (B), respectively. (c) and (d) temporal traces of M0 and fmean in the depicted ROIs. (e) and (f): temporal traces in the same ROIs when subtracting the spatially averaged signal over the entire image, i.e. M0 − 〈M0〉x,y, and fmean − 〈fmean〉x,y. See Visualization 1 (23.8MB, avi) and Visualization 2 (41.4MB, avi) for the juxtaposed movies of M0 and fmean corrected and not-corrected from the spatial average. Removing the spatial average allows to reveal the retinal flow waveforms.

