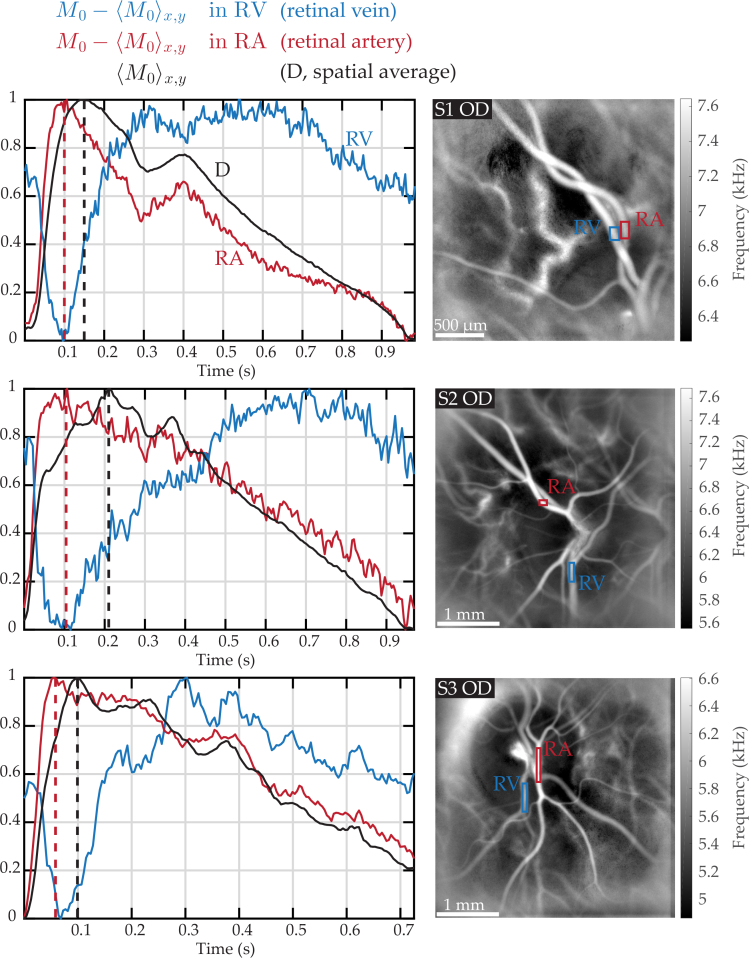
Fig. 3.
Venous and arterial retinal waveforms compared to the spatial average in three examples close to the ONH. Left column: normalized waveform in a retinal vein and artery (’RV’ in blue, and ’RA’ in red), and normalized waveform of the spatial average (over the entire image) in black. As seen from the red and black dashed lines indicating the end of systole, the venous minimum is more contemporary with the retinal arterial flow maximum than with the maximum of the spatial average. See Visualization 3 (14.8MB, avi) and Visualization 4 (68.3MB, avi) .

