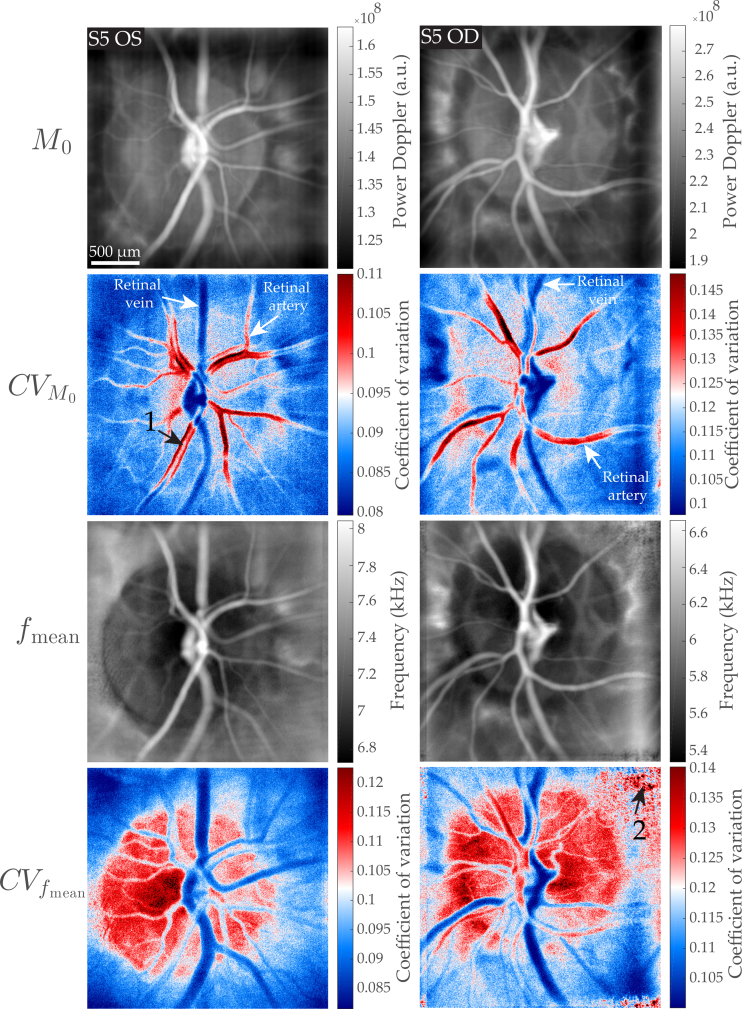
Fig. 5.
Comparison of CV maps obtained from the variation of M0 and fmean in the right and left eye of the same subject. From top to down: M0(x, y), CVM0(x, y), fmean(x, y), and CVfmean(x, y). The coefficient of variation in the optic disc differs significantly between the two methods. The arrow ’1’ and ’2’ point to areas where the Doppler broadening is undersampled and to low frequency noise, respectively.

