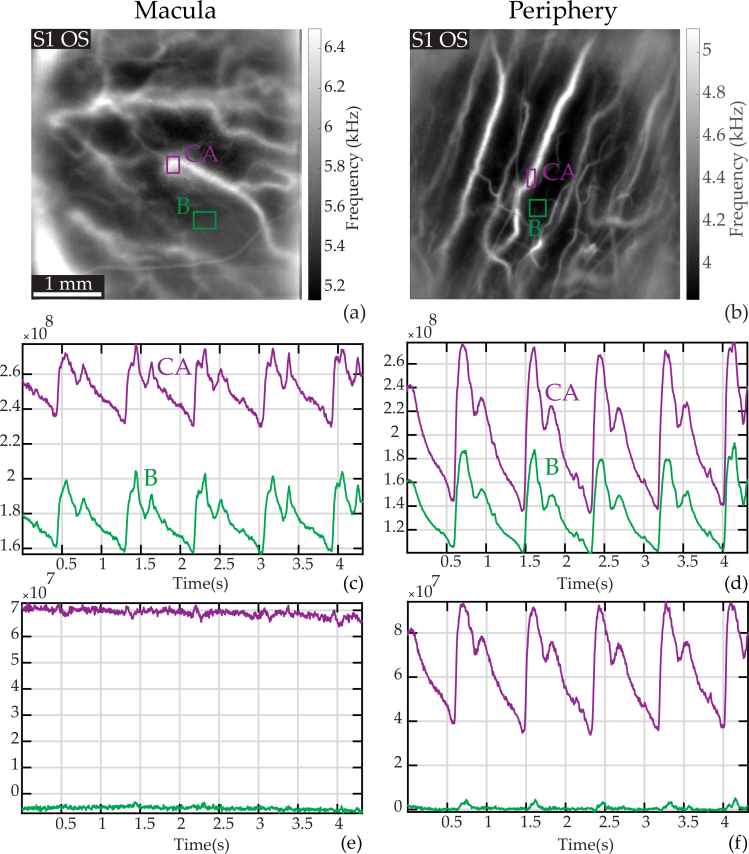
Fig. 6.
Laser Doppler measurements in choroidal arteries in the macular and peripheral regions. (a) and (b): Mean frequency images with ROIs on a large choroidal artery (’CA’, purple) and the background (’B’, green). (c) and (d): Raw power Doppler signal M0 in the ROIs. (e) and (f): Power Doppler signal in the same ROIs when subtracting the spatially averaged dynamic value, i.e., M0 − 〈M0〉x,y. In the peripheral region the power Doppler signal in ’CA’ corrected from the dominant signal yields a arterial-like waveform whereas the power Doppler signal measured in ’CA’ in the macular region shows only noise. This is probably because of the higher photoreceptors/RPE density, and because the dynamic signal measured in ’CA’ in the macula is exactly like the spatial average signal.

