Fig. 7.
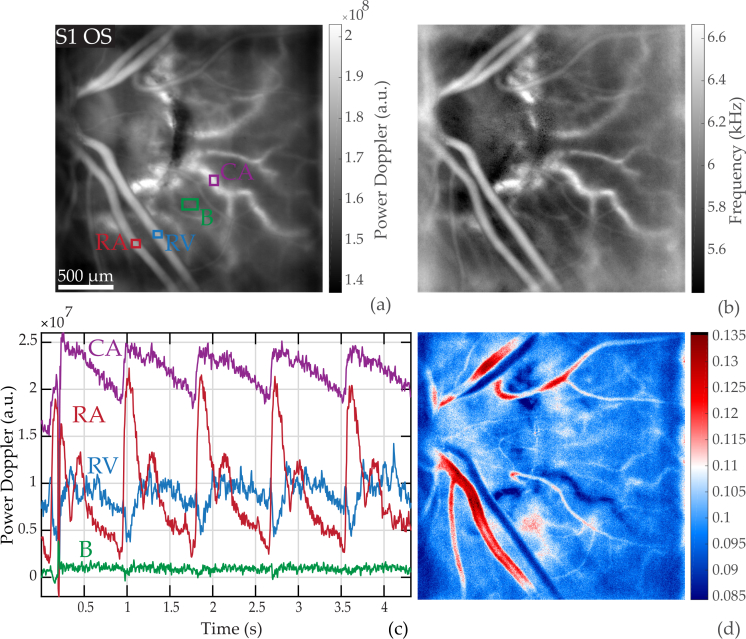
Pulsatile flow in the retina and choroid. (a) Power Doppler image M0(x, y) indicating the ROIs; the red, blue, green, purple boxes mark a retinal artery and vein, the background, and a choroidal artery, respectively. (b) Mean frequency shift image fmean(x, y). (c) Waveform of M0 − 〈M0〉x,y in the ROIs. (d) Coefficient of variation map CVM0(x, y): the choroidal artery has a coefficient of variation close to the values found in retinal veins, despite exhibiting an arterial waveform profile. See the power Doppler movie in Visualization 5 (46.6MB, avi) .

