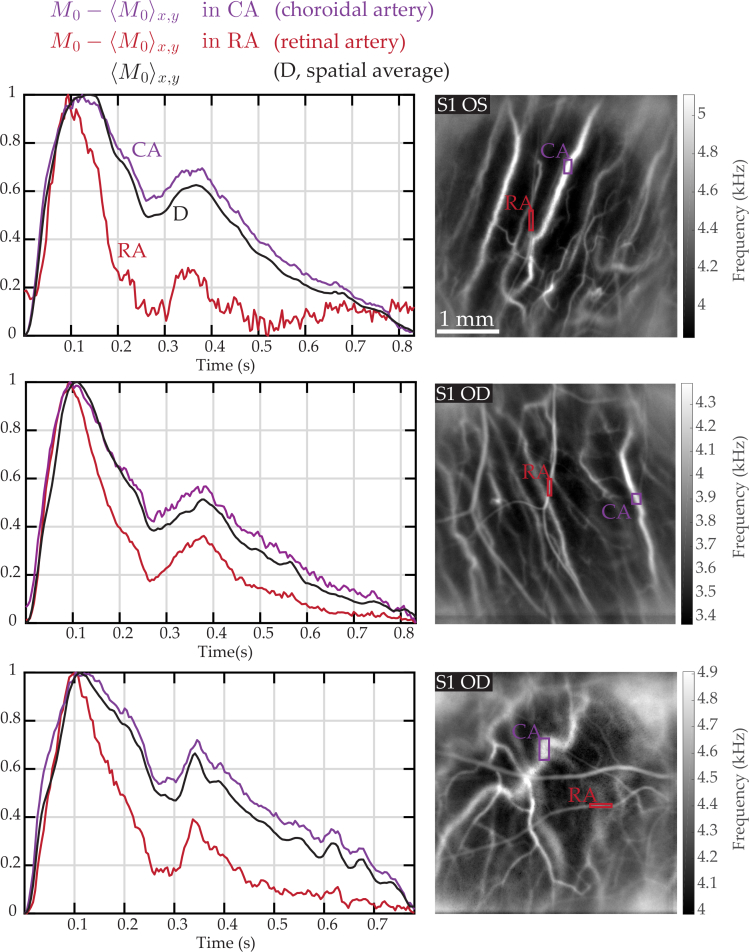
Fig. 8.
Retinal and choroidal arterial waveforms compared to the spatial average in three examples in peripheral regions. Left column: normalized waveform of power Doppler corrected from the spatial average in a retinal and a choroidal artery (’RA’ in red, and ’CA’ in purple), and normalized waveform of the Doppler signal spatially averaged over the entire image (’D’ in black). The dominant signal waveform has an arterial waveform, which strongly resembles that of choroidal arteries.

